Unlock store-level insights

Store Performance Intelligence™ is a video Voice-of-Customer program for multi-location brands. Your customers tell you what's working and what isn't, in their own words, at every location.

Southwest RegionWeek of Jul 28 · 155 locations · Region sentiment 78%

  • #0012Bay Street7180%+2.1%
  • #0240Fairview5276%−2.4%
  • #0142Westside Plaza8788%+10.6%

    Customer insight

    Long-time customer credits one team member by name for keeping them loyal, and says the location is consistently well run.

    Praise outlier
    • Staff Recognition14
    • Consistency9
  • #0031Downtown Centre11279%+1.4%
  • #0178Riverside Commons4368%−9.7%
  • #0221Harbor Point6677%−0.8%
  • #0096Willow Creek5880%+2.3%
  • #0054Lakewood Square3948%−29.5%

    Customer insight

    Customer was quoted a fifteen-minute wait at check-in, waited forty-five, and says no one explained the delay.

    Urgent flag
    • Wait Times11
    • Communication7
  • #0150Oak Hollow4975%−3.1%
  • #0073Lakeside Village9482%+4.0%
  • #0188Brookfield3571%−7.2%
  • #0205Eastfield Crossing5874%−3.8%
  • #0089Northgate Mall6481%+3.2%

    Customer suggestion

    Customer is happy with the service but asks for online booking, and suggests reserved parking near the entrance.

    On track
    • Online Booking6
    • Parking4
  • #0134Pine Ridge6179%+1.1%
  • #0117Sunset Strip2744%−33.8%
  • #0046Granite Falls10384%+6.4%
  • #0161Union Square5777%−1.2%
  • #0063Cedar Park7284%+6.0%

    Customer insight

    Customer says the experience is the same no matter who helps them, and that app check-in keeps visits quick.

    Praise outlier
    • Consistency10
    • App Check-in8
  • #0230Kingsgate6980%+2.6%
  • #0257Copper Hills6279%+1.0%
Illustrative locations, data and response summaries.

Scores tell you a store slipped. They don't tell you why.

NPS and star ratings show you which locations are up and which are down. Finding the reason means asking district and store managers, then waiting for their best guess to work its way back up. By then the damage is in the P&L, and the real reason is still unclear.

  1. Score dropsEveryone sees it in the dashboard
  2. Leadership asksWhy did Store #0054 slip?
  3. District managerFollows up with the store
  4. Store managerOffers a best guess
  5. You still don't know whyAnd it's costing you

The difference is in the answer

7xRicher data than traditional surveys*

Traditional survey

“Service was fine.”
  • Limited info
  • No context
  • No way to verify it's real
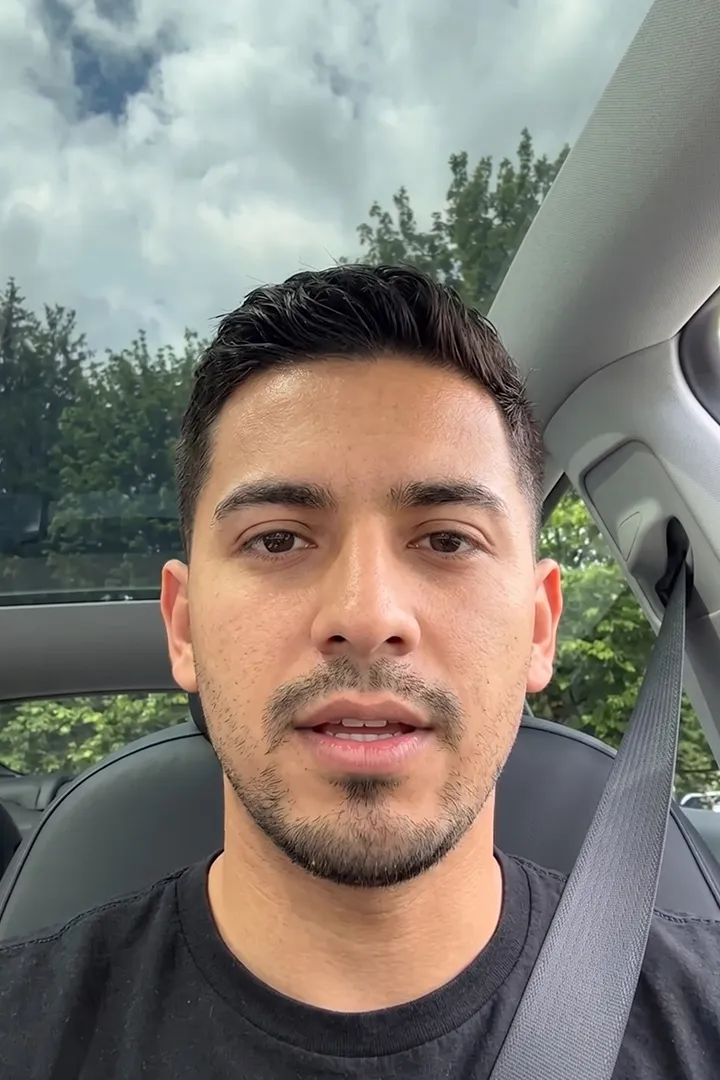
A customer recording a video response in his car

TONIQ survey response

Sentiment: Positive

Valid Response

“I like the prices here and I also like that there are records for all my haircuts stored in so it doesn't need to be repetitive. And one thing that they can do better is I guess have the standardized haircut professional throughout the visits that I have here in the future so that could help me know who my last hairdresser was.”

Feedback themes

  • Pricing
  • Visit Records
  • Service

Real response, anonymized. Simulated avatar.

What you get with TONIQ

  • Full transcript
  • Customer sentiment
  • Recurring topics
  • Response validation
  • Full video library

* Results of TONIQ pilot study.

What your customers see

  1. Customers get the survey

    A unique link reaches them after their visit.

    Sent by QR code, SMS, email or a link in your app.

  2. They watch your question

    A short video prompt, written and recorded with your team.

  3. They answer their way

    Video, voice or text, in their own words, from their phone.

  4. They get their reward

    Each response is checked in real time, so every insight comes from a real customer.

Built on proven technology

Powered by Emovid

Emovid's patent-pending capture method

One prompt, many responsesYour question goes out to customers at every store, and each one records an answer.
Every response in one placeAnswers from every store land side by side, ready to compare.
AI finds the patternsSentiment and themes, by store and across your network.

Patent pending · U.S. Patent Application No. 18/946,750 · Filed on the expedited track.

  • Tailored to your businessEvery program is designed around your goals, locations and customers.

  • Verified Human Communication™Every response is validated before it counts.

  • Secure by designSOC 2 compliant. Encrypted in transit and at rest.

Built around the way you already work

We set up each program around your existing channels, systems and reporting, so every response reaches the people who need it.

Reach

Our surveys work with the channels you already use to communicate with your customers.

  • QR on receipts and signage
  • SMS
  • Email
  • A link in your app

Data delivery

When needed, we can connect response data to the systems your teams already use.

Reporting

Weekly reports for every level of your organization, each linked to the full response library.

  • Sentiment
  • Recurring topics
  • Urgent flags
  • Custom report formats

TONIQ InsightsMon 7:00 AM

Your weekly store performance report

Two locations flagged for follow-up. Wait times led recurring topics this week.

Weekly-Store-Report.pdf

Illustrative report. Sample data.

Made for multi-location operators

  • Salons & Barbershops
  • Med Spas & Massage
  • Fitness & Wellness
  • Dental, Vision & Pet
  • Restaurants
  • Retail
  • Automotive & Travel
  • Entertainment & Events

From kickoff to your first report

  1. Kickoff

    We align on goals, write your questions and plan customer rewards.

  2. Setup

    We set up how customers reach the survey and where the data goes, including any integrations with your systems.

  3. Go live

    Customers start responding across participating locations.

  4. Ongoing reporting

    Reports arrive every week at every level, and your data flows into the tools your teams use.

Drive store results with the why.

Tell us about your locations and what you want to learn. We'll walk you through what a program would look like for your business.

Schedule a call